

Hillsborough County Market Brief — October 2026
Hillsborough County's October single-family median sale price rose 4.8% from a year earlier, while closed sales fell 9.0%. The countywide picture differed from several of its towns: five of the eight communities below recorded lower monthly medians, even as seven had higher year-to-date medians.
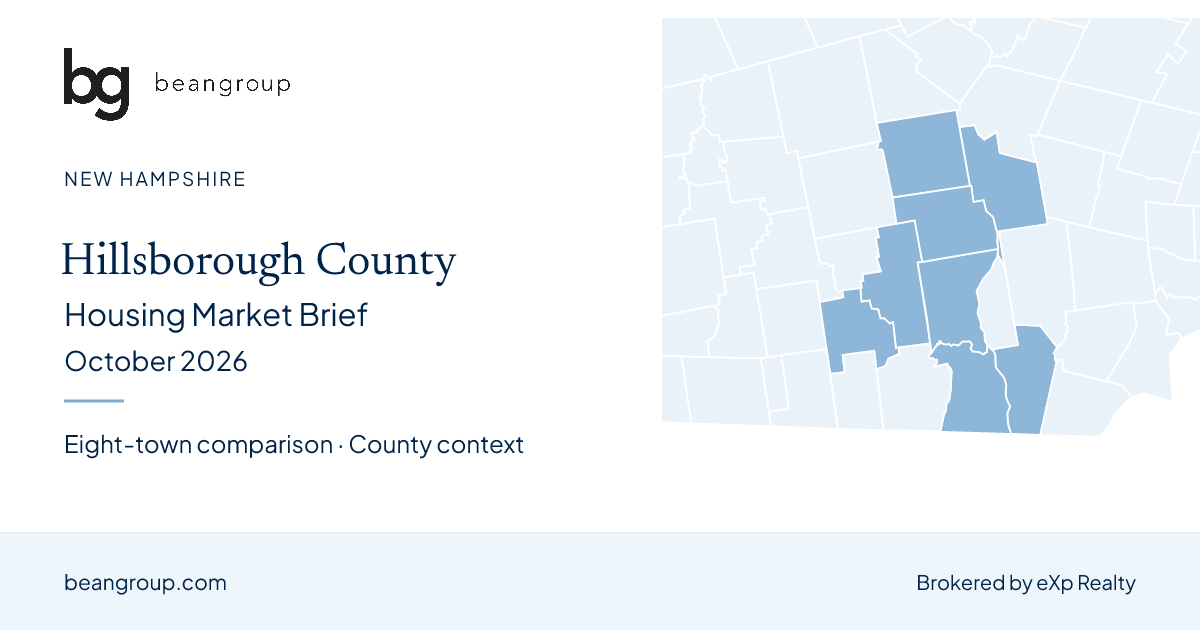
This brief pairs the county figures with local reports for Manchester, Nashua, Bedford, Amherst, Merrimack, Hudson, Milford and Goffstown. All figures cover single-family homes and come from published New Hampshire REALTORS® reports current as of November 5, 2026. The county figures cover the whole county; the eight-town comparison is a selected local view, not a combined county statistic. The cover map highlights those eight towns.
Explore Hillsborough County · October New Hampshire report · Discuss your move with Michael Bean
The county picture
Changes compare October 2026 with October 2025. These county figures are from page 15 of NHAR's October Monthly Indicators.
| County metric | October 2026 | October 2025 | Change |
|---|---|---|---|
| Closed sales | 284 | 312 | -9.0% |
| Median sale price | $550,000 | $525,000 | +4.8% |
| Sales volume, millions | $176.4 | $184.0 | -4.1% |
| Average days on market | 24 | 21 | +14.3% |
| Pending sales | 293 | 316 | -7.3% |
Through October, the county recorded 2,732 closings, up 6.3% from 2,569 in the same period of 2025. Its year-to-date median was $570,000, up 2.5% from $556,000. October's lower sales count therefore sits within a year that has recorded more closings overall.
October prices and sales by town
The linked town reports contain the full monthly and year-to-date tables. Percentage changes below compare monthly median sale prices with October 2025.
| Town | Closed sales | Median sale price | Median change |
|---|---|---|---|
| Manchester | 58 | $465,250 | -1.0% |
| Nashua | 51 | $498,000 | -7.8% |
| Bedford | 19 | $835,000 | -5.9% |
| Amherst | 11 | $670,000 | +4.7% |
| Merrimack | 22 | $590,000 | +3.1% |
| Hudson | 14 | $585,000 | +0.5% |
| Milford | 9 | $455,000 | -17.6% |
| Goffstown | 18 | $517,500 | -4.0% |
Manchester recorded 58 closings, down from 65, with a $465,250 median. Nashua recorded 51 closings, up from 49, while its median fell 7.8% to $498,000. A higher sales count does not necessarily accompany a higher median price.
Merrimack's closings rose from 14 to 22 and its median increased 3.1% to $590,000. Amherst and Hudson also recorded higher monthly medians. Bedford, Milford and Goffstown joined Manchester and Nashua in recording lower monthly medians.
Milford's 17.6% median decline reflects nine closings, compared with eight a year earlier. Amherst had 11 closings and Hudson had 14. Changes in the mix of homes sold can affect a small monthly sample; these figures do not measure the appreciation or depreciation of an individual home.
The year-to-date comparison
These figures cover January through October in each year, rather than October alone.
| Town | Closed sales, 2026 YTD | Median sale price, 2026 YTD | Median change from 2025 YTD |
|---|---|---|---|
| Manchester | 617 | $475,000 | +2.2% |
| Nashua | 427 | $575,000 | +4.6% |
| Bedford | 180 | $845,000 | +3.7% |
| Amherst | 117 | $720,000 | +6.7% |
| Merrimack | 203 | $620,000 | +4.2% |
| Hudson | 142 | $600,000 | -4.0% |
| Milford | 99 | $575,000 | +1.8% |
| Goffstown | 116 | $547,500 | +6.3% |
Nashua's monthly median fell 7.8%, but its year-to-date median rose 4.6% to $575,000. Milford's year-to-date median rose 1.8% to $575,000 despite its lower October median. Hudson moved in the opposite direction: its monthly median rose 0.5%, while its year-to-date median fell 4.0% to $600,000. Read both periods before treating one month's result as a broader trend.
Inventory and time on market
Inventory here belongs to the October reports. Live search results describe a later date and may include different property types.
| Town | Homes for sale, October 2026 | October 2025 | Days on market until sale, October 2026 | Months supply |
|---|---|---|---|---|
| Manchester | 69 | 70 | 15 | 1.1 |
| Nashua | 75 | 44 | 19 | 1.8 |
| Bedford | 34 | 24 | 22 | 1.9 |
| Amherst | 24 | 17 | 32 | 2.1 |
| Merrimack | 24 | 13 | 18 | 1.2 |
| Hudson | 28 | 24 | 14 | 1.9 |
| Milford | 16 | 9 | 15 | 1.7 |
| Goffstown | 19 | 12 | 22 | 1.6 |
Seven of these eight towns had more homes for sale than a year earlier; Manchester had one fewer. Nashua's inventory increased from 44 to 75, and Merrimack's rose from 13 to 24. Reported supply ranged from 1.1 months in Manchester to 2.1 in Amherst.
Average days on market until sale fell in Manchester and Bedford and rose in the other six towns. Bedford's average declined from 43 to 22 days, while Amherst's increased from 19 to 32. These averages describe the homes sold during the period and do not predict the time needed to sell a particular property.
What to compare if you are buying
Start with the communities and property types that fit your plans, then compare current listings with recent similar sales. October inventory and supply figures provide context, but today's availability, condition and price range matter to the options you can actually consider. Use each town report to identify questions for your search rather than assuming the county median describes every local market.
What to compare if you are selling
Review recent comparable sales and current competition before setting a price. A countywide median increase does not establish an increase in your home's value, and a town's lower monthly median does not by itself establish a loss. Location, condition, size and the mix of properties sold all matter to that comparison.
Get my home's value · Explore Hillsborough County communities
Sources and method
County figures: NHAR October 2026 Monthly Indicators, page 15. Town figures: the eight NHAR Local Market Updates, each linked from its full town report. All published source reports are current as of November 5, 2026, using New Hampshire REALTORS®, PrimeMLS and ShowingTime Plus data.
All tables cover single-family residences. Monthly comparisons are with October 2025; year-to-date comparisons are with January–October 2025. Figures and percentage changes retain the values printed in the sources. Median prices do not account for sale concessions or downpayment assistance. Published changes use rounded figures, and small samples can produce large percentage changes. Later reports may revise earlier data. Report © 2026 ShowingTime Plus, LLC.
Bean Group prepared this comparison from the published sources. Town medians are not averaged into a county median, and no appreciation rate or market forecast is inferred from them.