

NH Seacoast Market Brief — October 2026
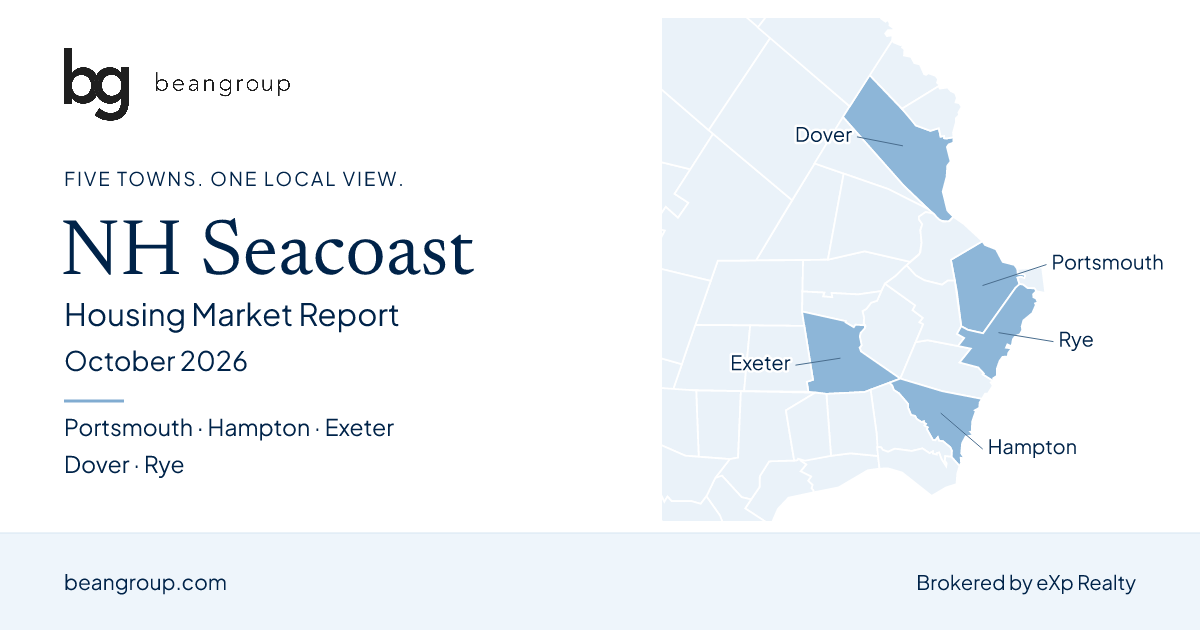
October single-family median sale prices were lower than a year earlier in all five towns in this comparison, while sales counts moved in different directions. Portsmouth, Hampton and Dover recorded more closings; Exeter recorded fewer; Rye's count was unchanged. These monthly results describe different groups of homes, with six closings in Rye and 21 in Dover.
This brief compares Portsmouth, Hampton, Exeter, Dover and Rye using the New Hampshire REALTORS® Local Market Updates for October 2026, with published source data current as of November 5, 2026. It compares five towns rather than calculating a combined statistic for the entire NH Seacoast. All tables cover single-family homes, not condos or all residential property types.
Compare Seacoast towns · Explore Seacoast homes · Discuss your move with Michael Bean
October prices and sales
Changes below compare October 2026 with October 2025. The linked town reports include the complete monthly and year-to-date tables.
| Town | Closed sales | Median sale price | Median change |
|---|---|---|---|
| Portsmouth | 17 | $880,000 | -2.2% |
| Hampton | 12 | $644,950 | -10.4% |
| Exeter | 11 | $761,000 | -8.9% |
| Dover | 21 | $579,900 | -5.7% |
| Rye | 6 | $1,317,500 | -25.5% |
Portsmouth recorded 17 closings, compared with 11 in October 2025. Its monthly median was $880,000, down 2.2%, while its year-to-date median was also $880,000, down 1.8%. Through October, 119 homes had sold, compared with 147 in the same period of 2025. A stronger single month's sales count does not erase the year-to-date difference.
Hampton and Dover illustrate why it helps to read both time periods. Hampton's monthly median fell 10.4%, but its year-to-date median rose 6.9% to $791,000. Dover's monthly median fell 5.7%, while its year-to-date median rose 9.7% to $620,000. These are different sets of sales, not competing estimates of an individual home's value.
Rye's monthly median declined 25.5% across six closings, the same number as a year earlier. Its year-to-date median rose 24.2% to $1,550,000 across 55 closings. Exeter's monthly median was down 8.9%, and its year-to-date median was down 11.1% to $747,000. Review the homes behind a small sample before using a median to guide a pricing decision.
Inventory and time on market
These inventory counts belong to the October source reports. Current search results describe a later date and may use a different property-type selection.
| Town | Homes for sale, October 2026 | October 2025 | Days on market until sale, October 2026 | Months supply |
|---|---|---|---|---|
| Portsmouth | 41 | 47 | 30 | 3.2 |
| Hampton | 35 | 27 | 23 | 3.2 |
| Exeter | 18 | 19 | 44 | 2.4 |
| Dover | 51 | 43 | 33 | 3.0 |
| Rye | 17 | 20 | 21 | 3.0 |
Hampton and Dover had more homes for sale than a year earlier; Portsmouth, Exeter and Rye had fewer. Hampton's inventory rose from 27 to 35, while Portsmouth's fell from 47 to 41. The statewide inventory increase does not describe every town's direction.
Exeter's average days on market until sale increased from 26 to 44. Rye's fell from 63 to 21, while Portsmouth, Hampton and Dover also recorded lower averages. These figures describe the homes sold during the reporting period; they do not predict how quickly a particular listing will receive an offer.
What to compare if you are buying
Use the town reports to shape questions for your search. Compare current asking prices with recent sales of similar homes, then examine condition, lot, layout and maintenance needs. A lower monthly town median does not establish that a specific listing is a bargain or that its value has fallen by the same percentage.
Keep single-family and condo searches separate when interpreting these figures. For a condo, review association fees, reserves, rules and responsibilities alongside the purchase price; the tables above do not describe condo sales.
Portsmouth homes · Hampton homes · Exeter homes · Dover homes · Rye homes
What to compare if you are selling
Start with recent comparable sales and today's competition for your home's property type and location. Read the monthly and year-to-date figures together, especially where only a few homes closed. Discuss preparation, pricing and your moving timeline before choosing an asking price.
Request a property-specific home value review or discuss your Seacoast sale or purchase with Michael Bean. A town median is not an appraisal or a valuation of your home.
October reports for more Seacoast towns
The October set also includes North Hampton, Greenland, Stratham, Newmarket, Seabrook, Durham and Somersworth. Each uses its own town's source; county statistics are not substituted for town data.
Small samples matter in these communities too. North Hampton's monthly median of $1,875,000 came from three closings, and Greenland's $1,412,450 median came from four. Seabrook's report leaves the prior-year monthly median list price and two monthly percentage changes unreported; its detailed table preserves those gaps as dashes.
For broader context, read the October New Hampshire report. The September Seacoast brief remains available as a historical report. Find earlier town reports and other areas in the market report library.
Sources and method
Source: New Hampshire REALTORS®, PrimeMLS and ShowingTime Plus, October 2026 Local Market Updates, published data current as of November 5, 2026:
- Portsmouth original report
- Hampton original report
- Exeter original report
- Dover original report
- Rye original report
The seven additional town reports each link their own original October PDF. Figures and percentage changes retain the values printed in the sources. Comparisons are with the same period one year earlier, not the preceding month. Median prices do not account for sale concessions or downpayment assistance. Published changes use rounded figures, and small samples can produce large percentage changes. Later reports may revise earlier data. Report © 2026 ShowingTime Plus, LLC.
Bean Group prepared this comparison from the published sources. Town medians are not averaged into a regional median, and no appreciation rate or market forecast is inferred from them. The NHAR report library provides the original reporting series.